
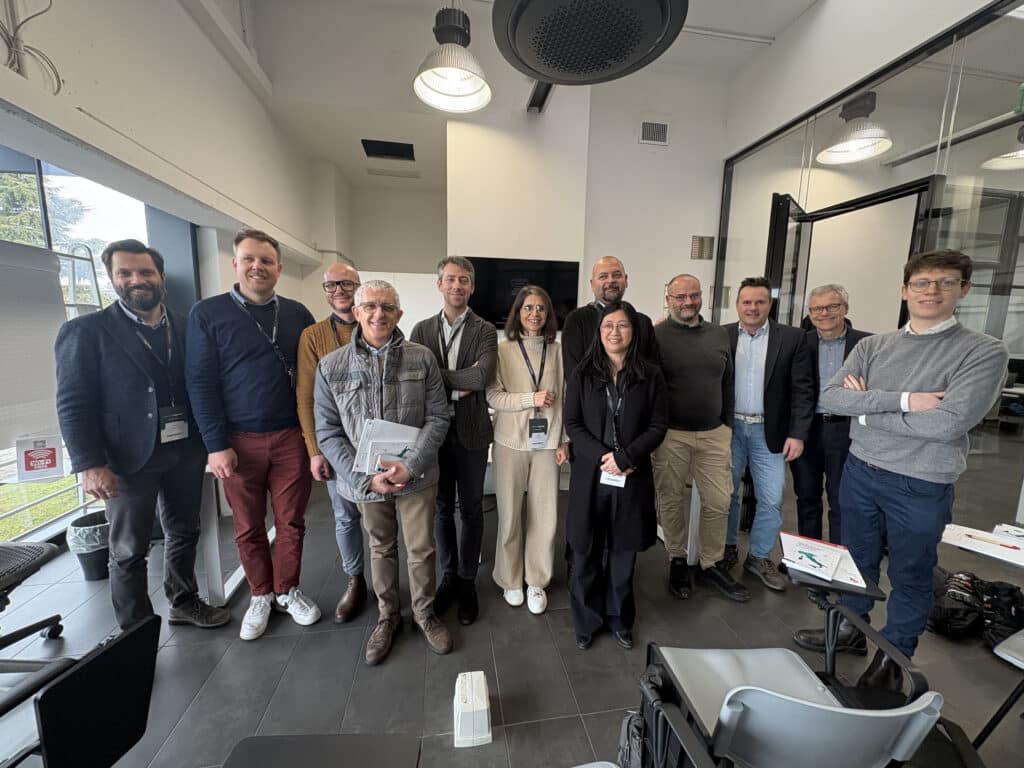
An absolutely positive outcome. I’m still keen to dive deeper into the Wepladoo side, but I look forward to doing so in a dedicated session.

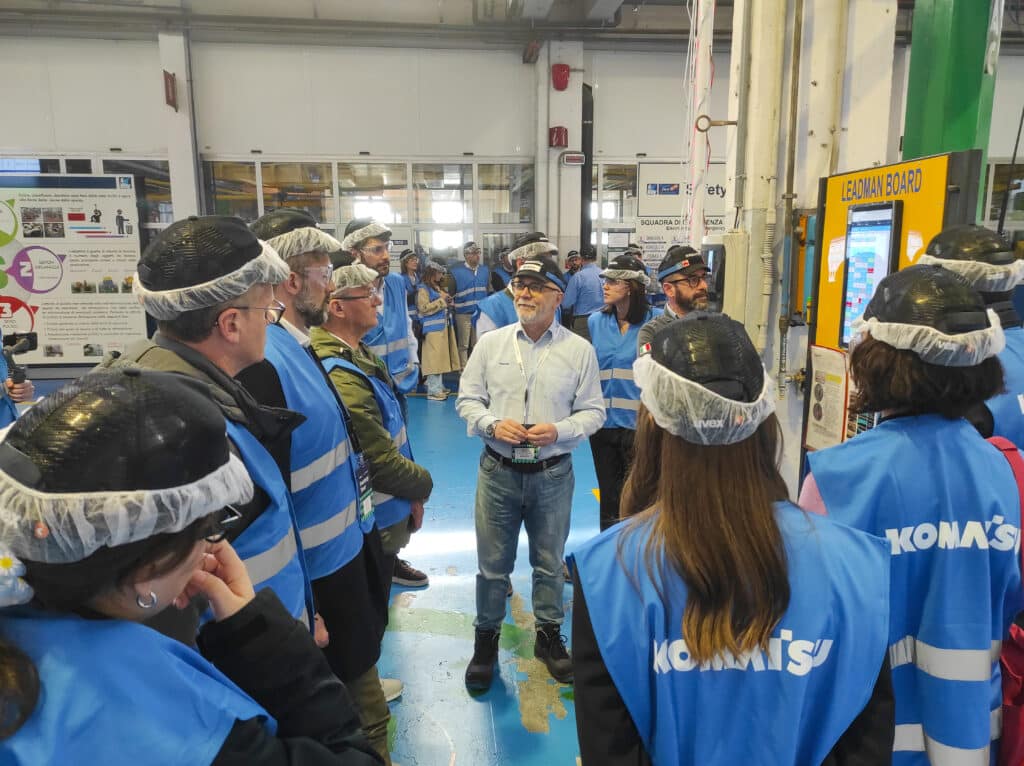
An excellently organized event, rich in valuable content. A great opportunity to discover "Digital Galvanizing" and build new professional connections. Congratulations to the entire team!
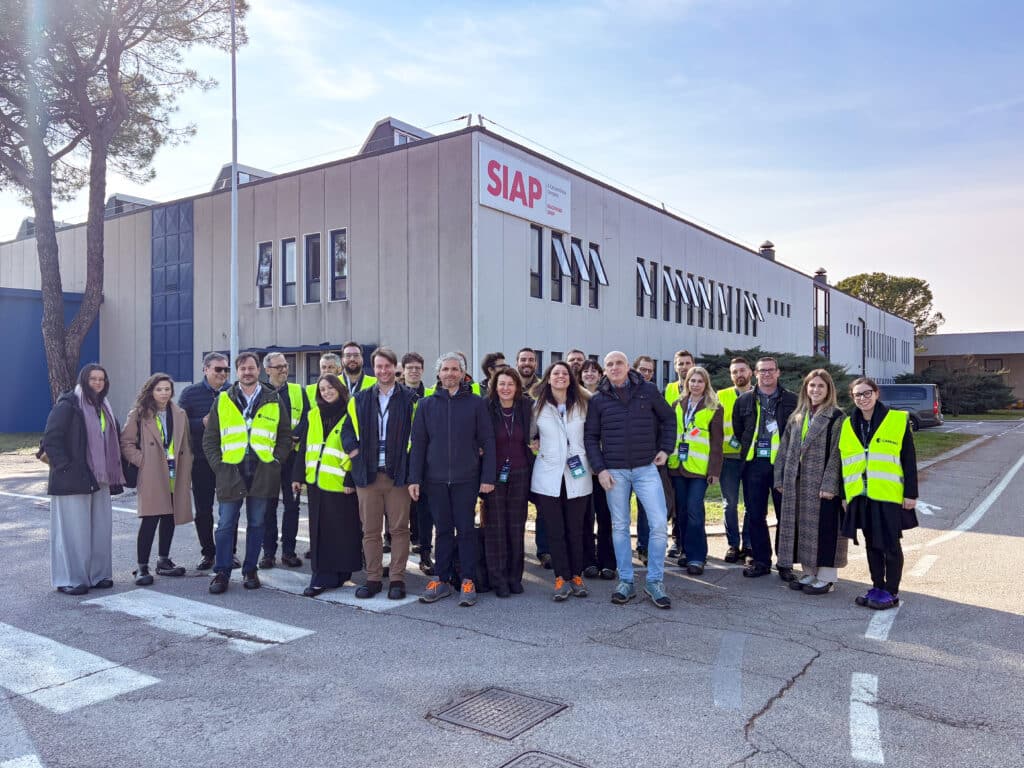
Un'occasione unica per visitare un'altra realtà produttiva, oltre che per comprendere l'utilizzo pratico del software awm suite. Ho trovato molto interessante scoprire le modalità organizzative di un altro stabilimento e le soluzioni adottate per la gestione della fabbrica.